
Mars Petcare’s Kinship data studio uses data to drive innovation opportunities in animal health. We worked with them to design interactive data visualizations that the organization could use to analyze trends and grow their businesses.
The challenge? How to make complex behavioral and contextual data engaging and relevant – and how to showcase the data and analytics team’s work, embedding a data-driven approach as a key driver across all of Mars Petcare.
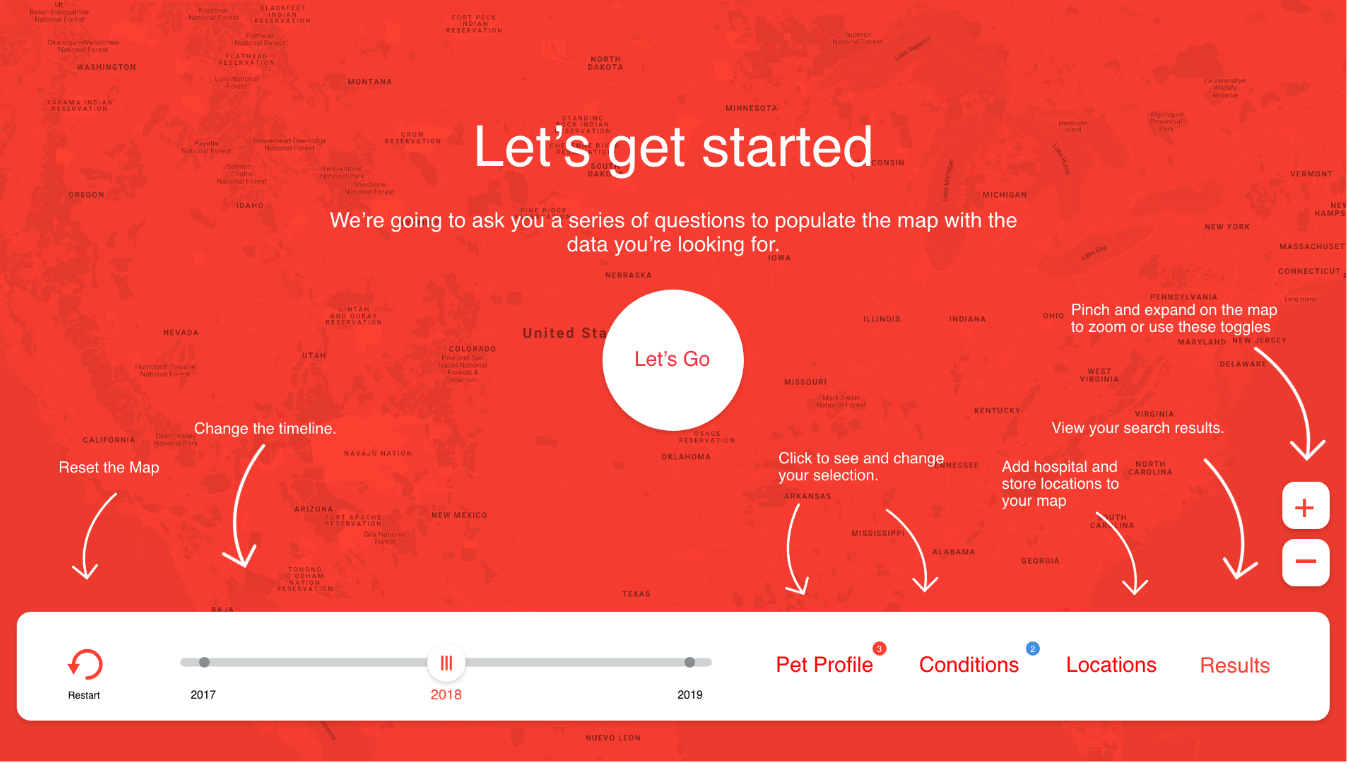
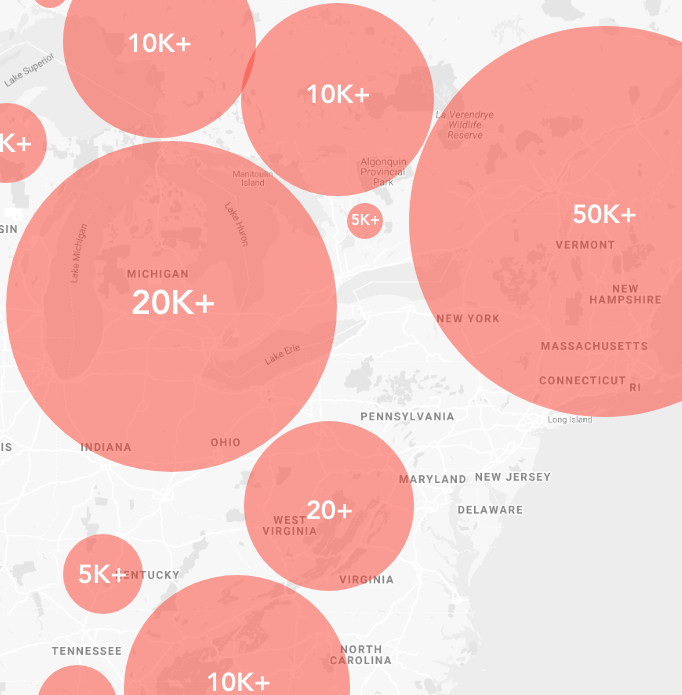
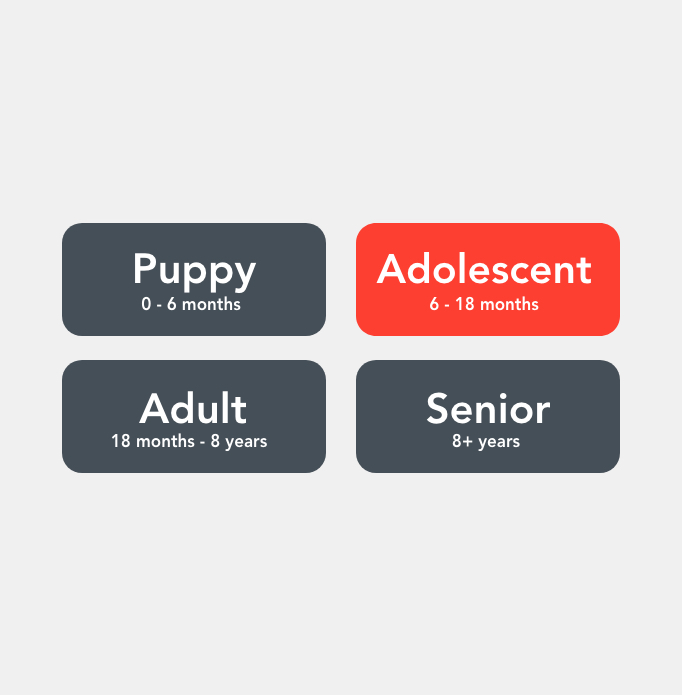
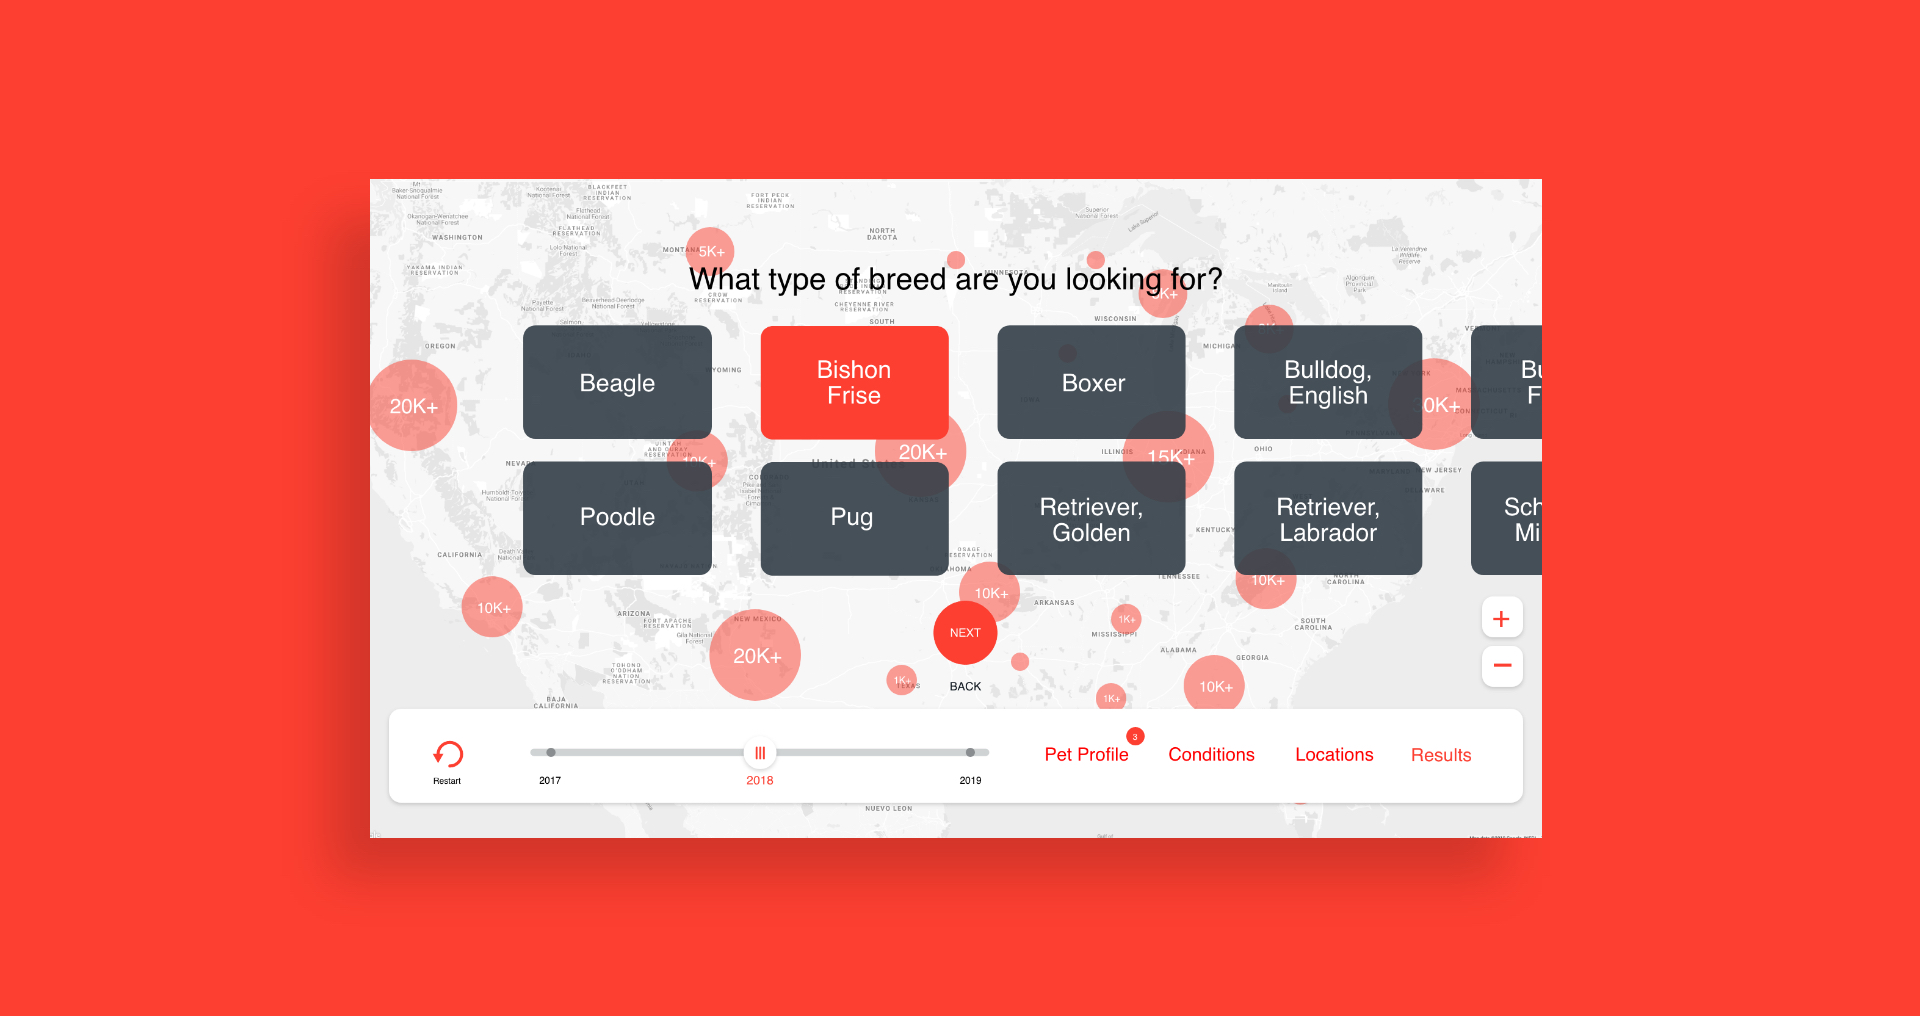
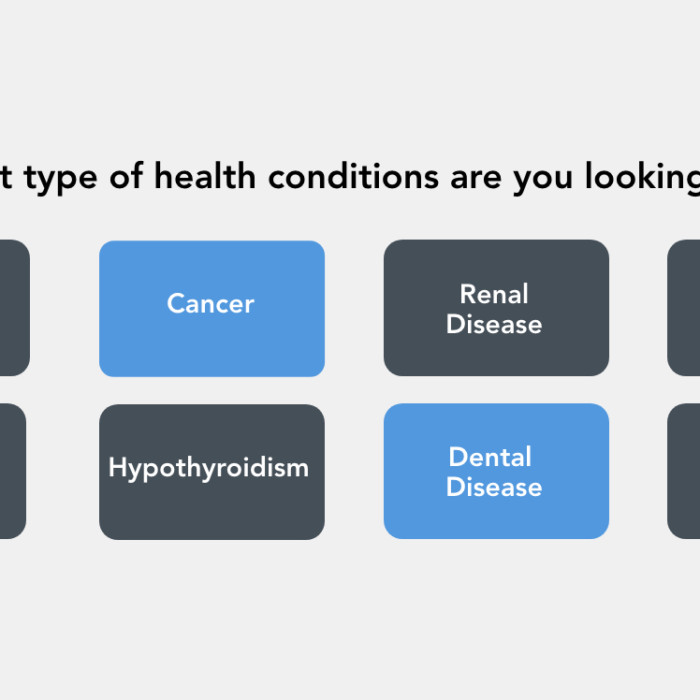
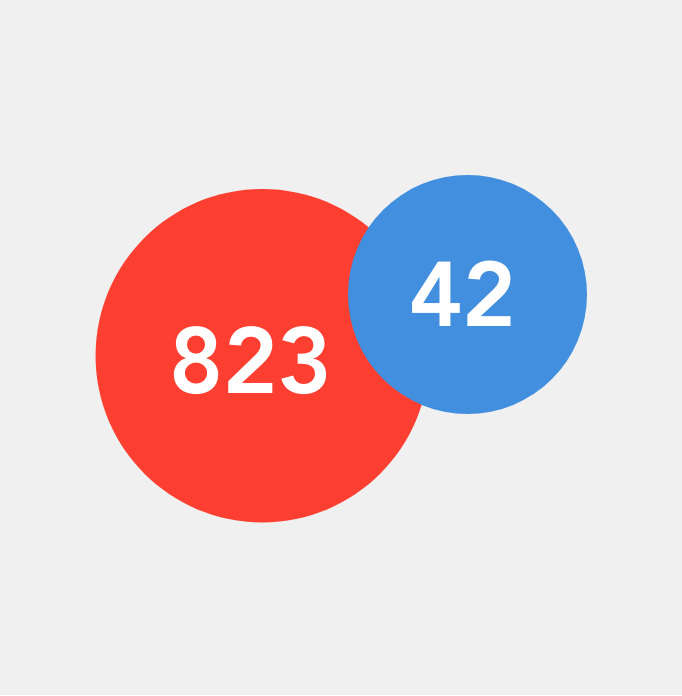
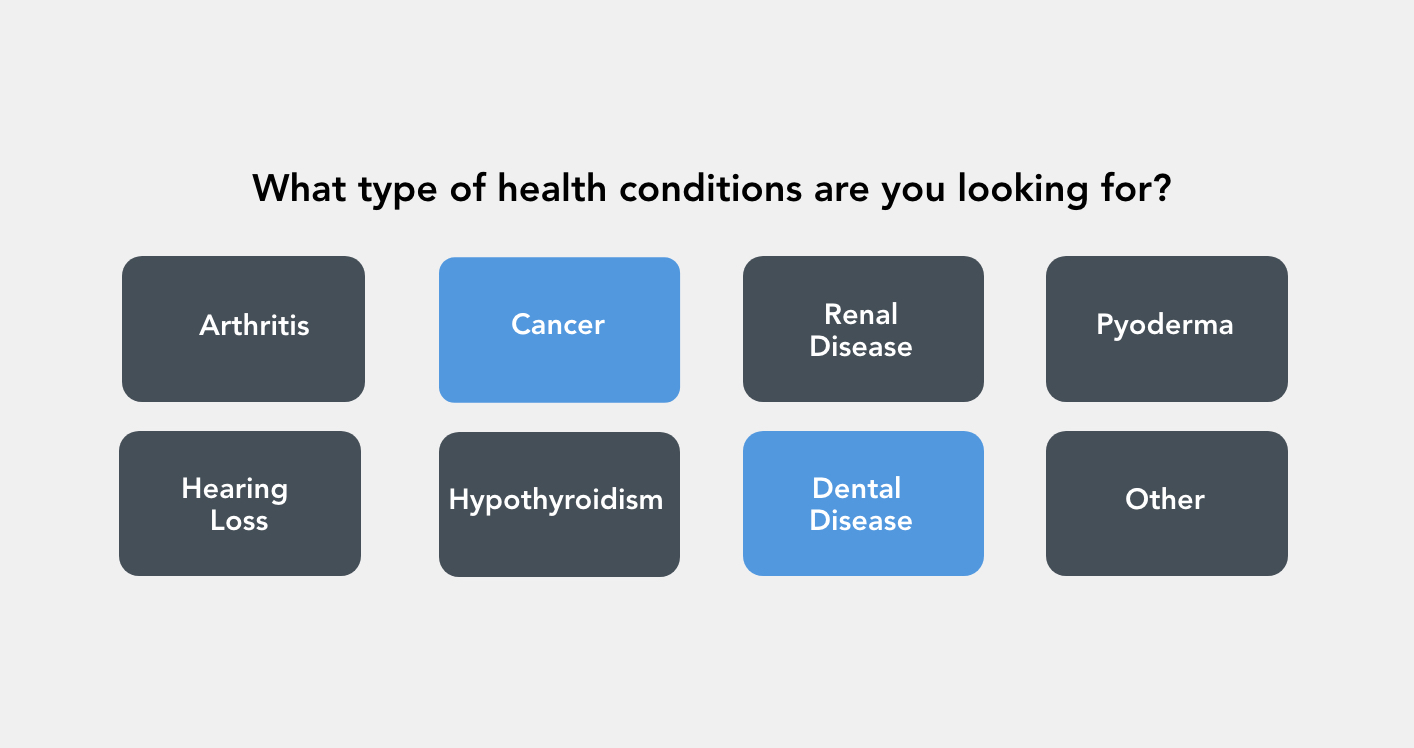
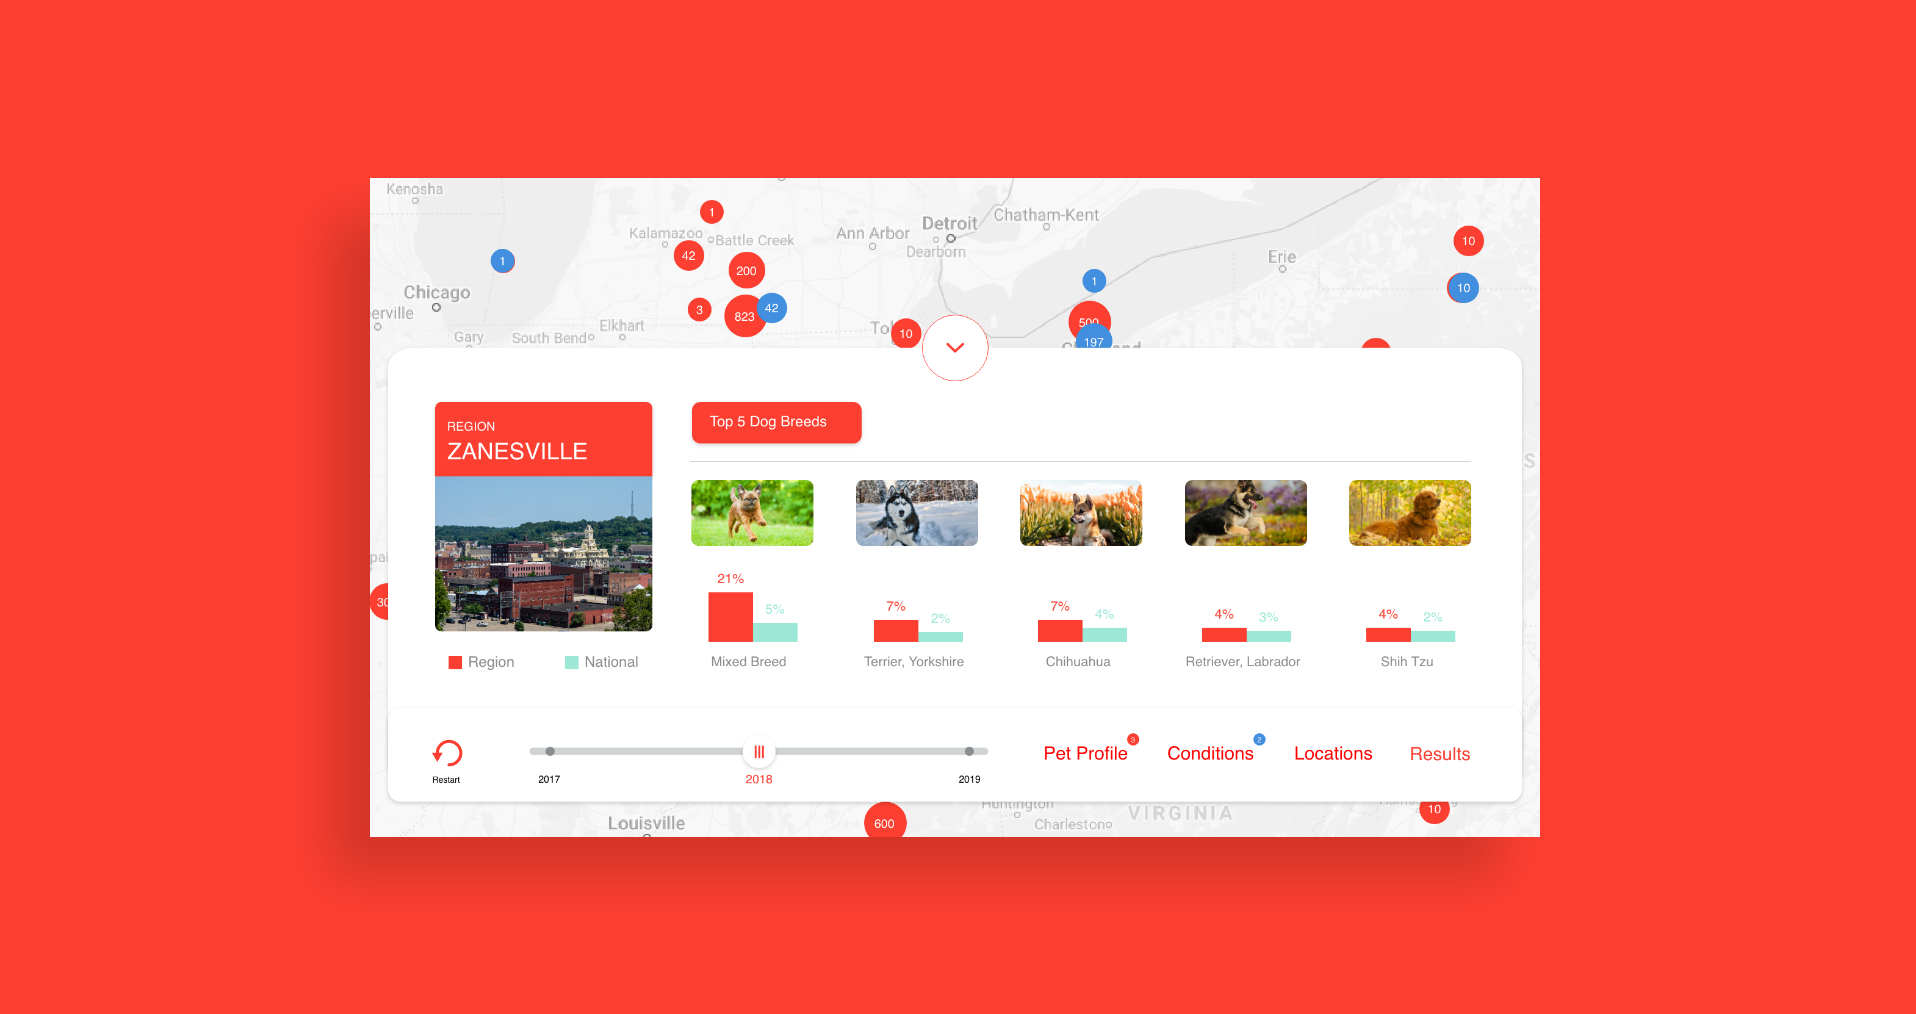
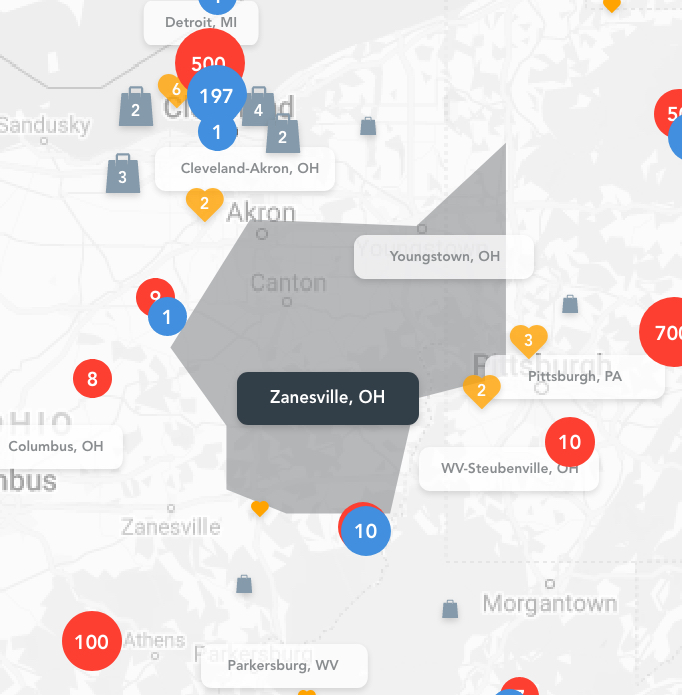
Our solution? To focus on creating a hyper-personal user experience. Through dynamic heat maps and graphs, we delivered the crisp, clean displays Kinship needed, and the interactivity their users demanded. Bold graphics and simple interfaces helped transform diverse data sets (medical records, appointments data, activity tracking, DNA and disease risk data etc.) into actionable insights that added up to a pet-centric view of the business.
By enabling people to easily evolve and test ideas through sophisticated analytics, the Kinship data studio’s agile framework helps to ensure Mars Petcare achieves its mission: building a better world for pets.
Data Strategy / Data Visualization + Infographics / UX & UI Design / Visual Design