Mars Petcare Data Studio
The Kinship Data and Analytics team had compelling data and no compelling way to share it. We designed and built two interactive experiences that made their work accessible, explorable, and impossible to ignore.
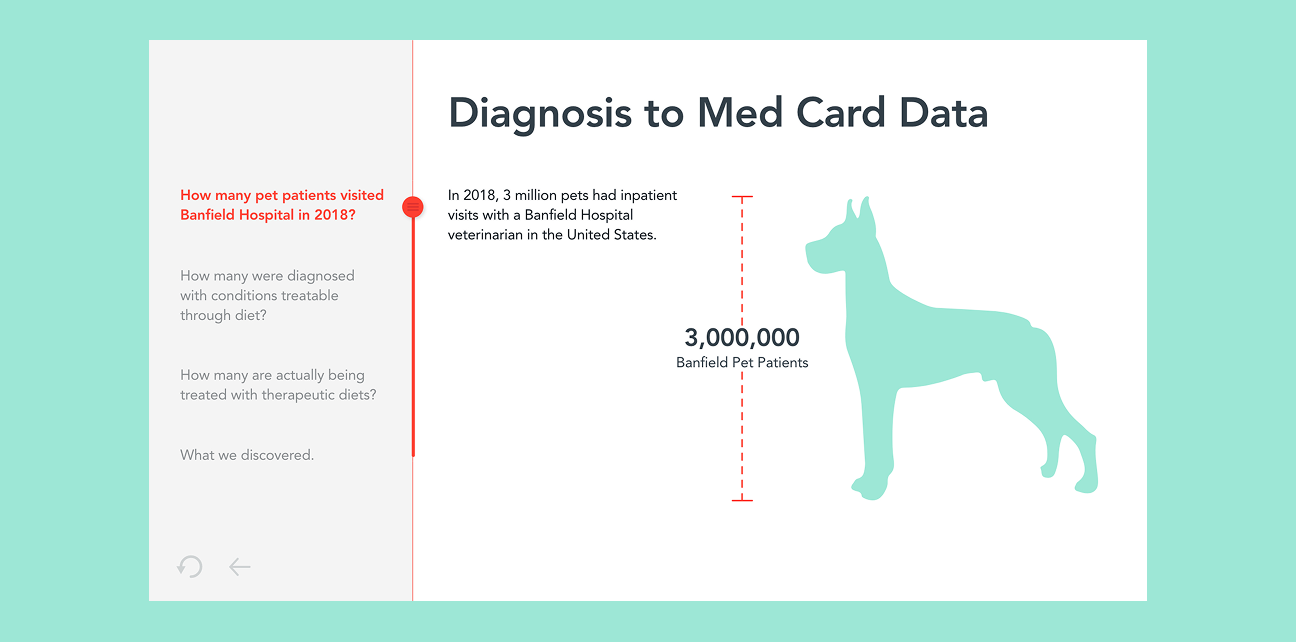
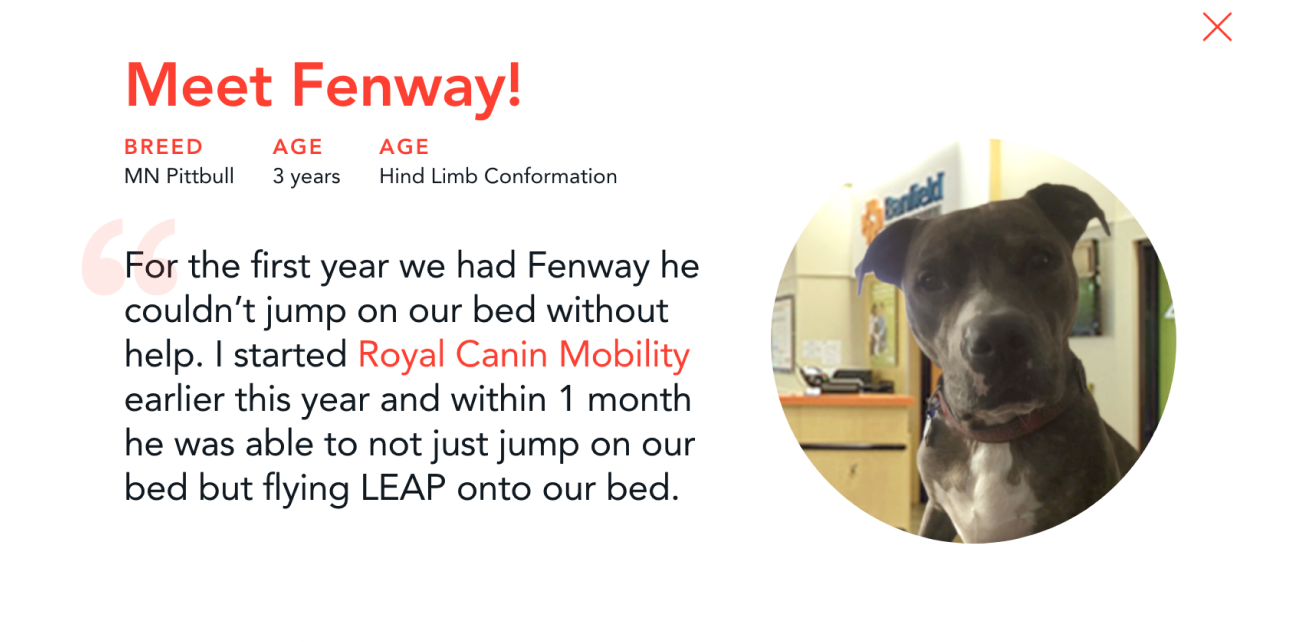
The Kinship Data and Analytics team sits at the center of Mars Petcare's cross-divisional intelligence operation, generating insights that touch every brand in the portfolio. Their challenge wasn't the data. It was making it legible and engaging for audiences ranging from startup founders to C-suite leaders, many of whom had little background in data. Medical records, appointment data, activity tracking, DNA profiles, and disease risk data all needed to add up to something a room full of non-analysts could act on.

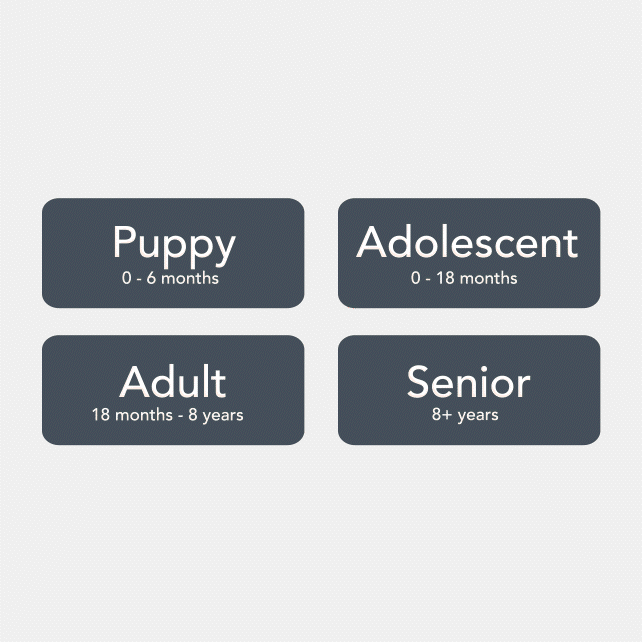
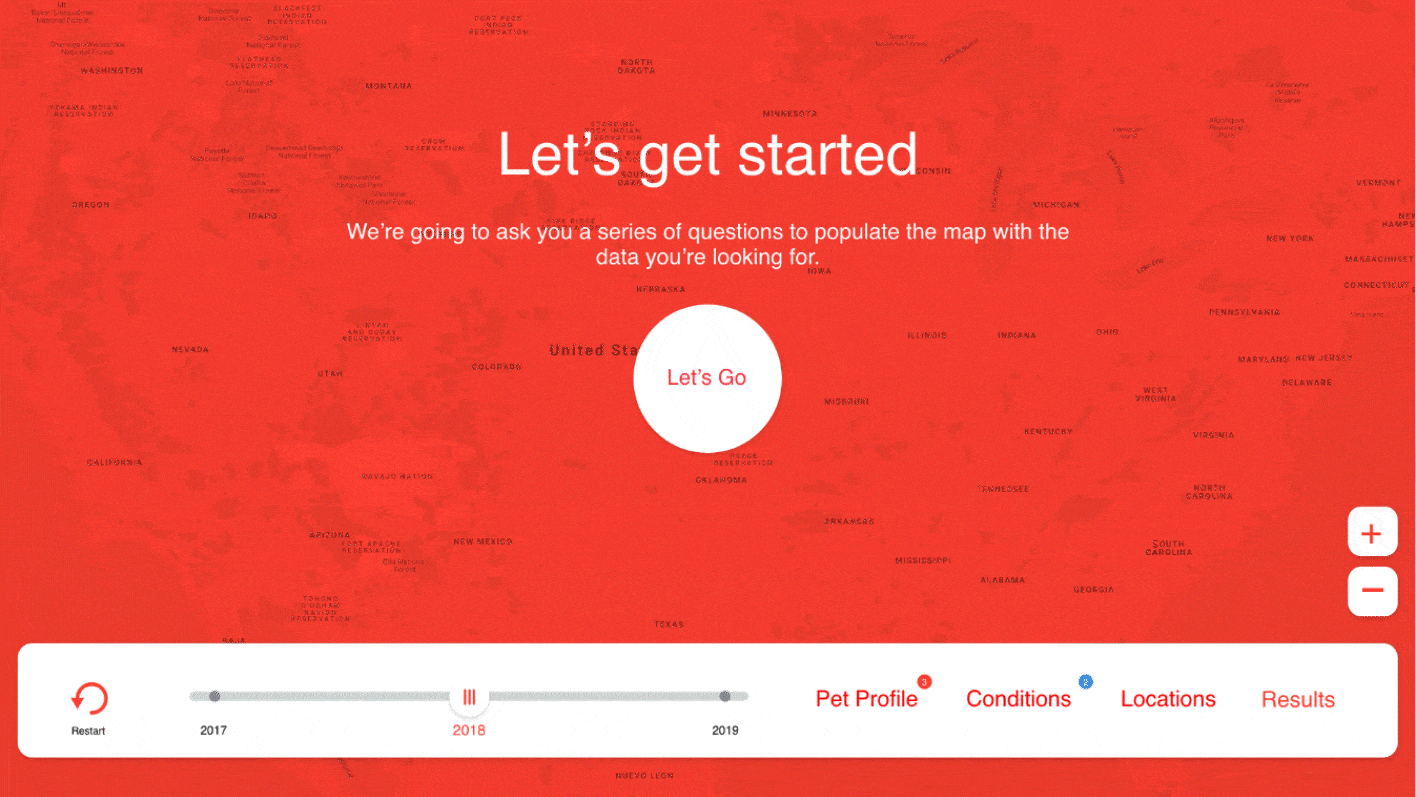
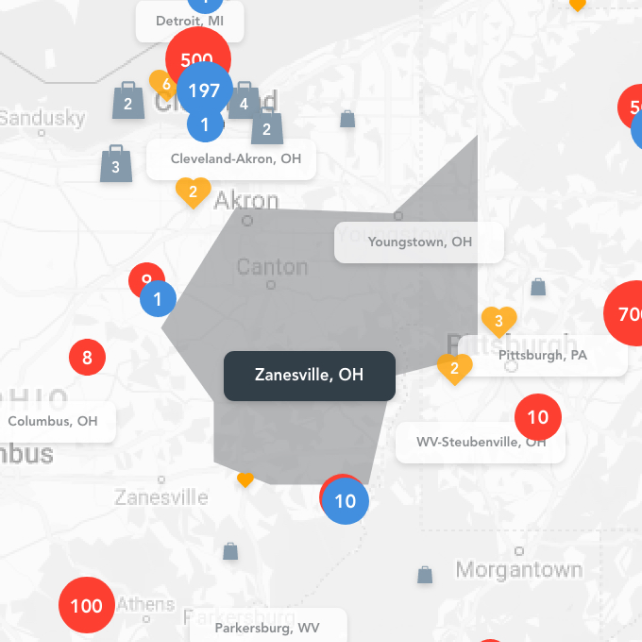
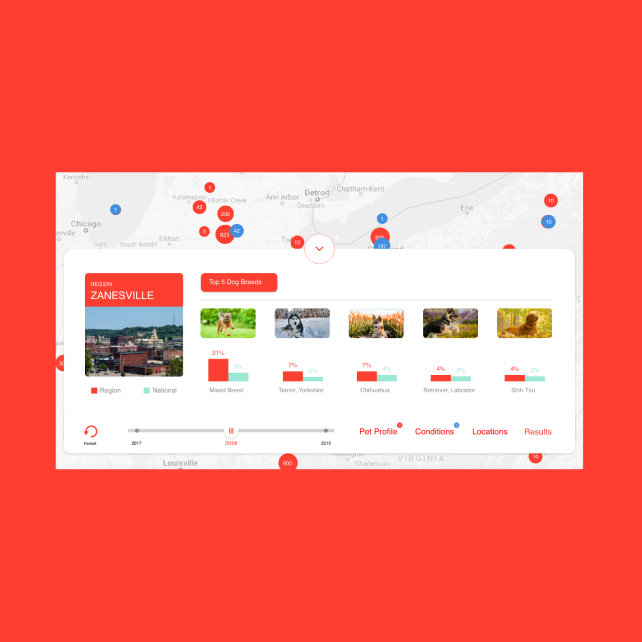
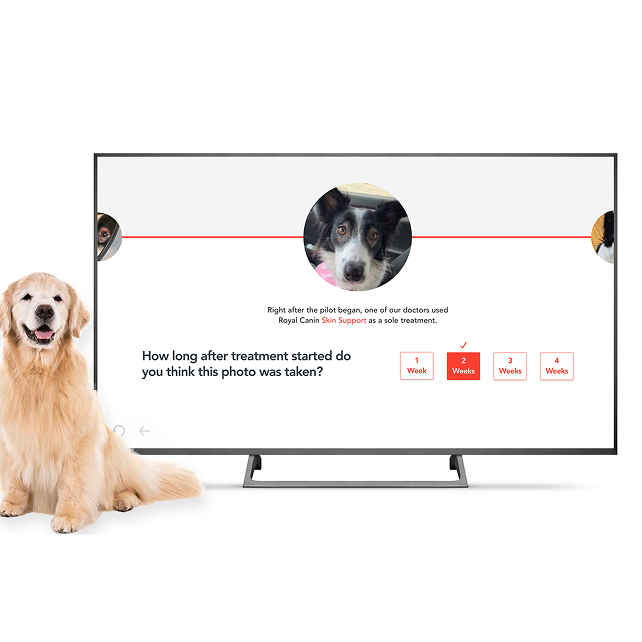
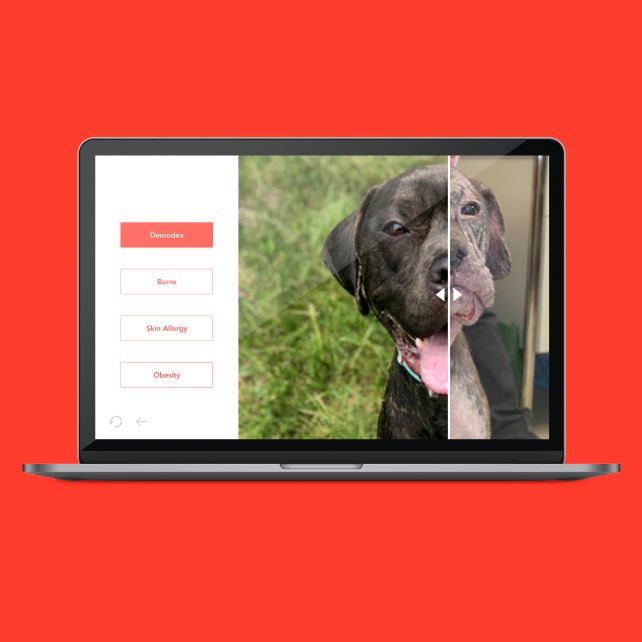
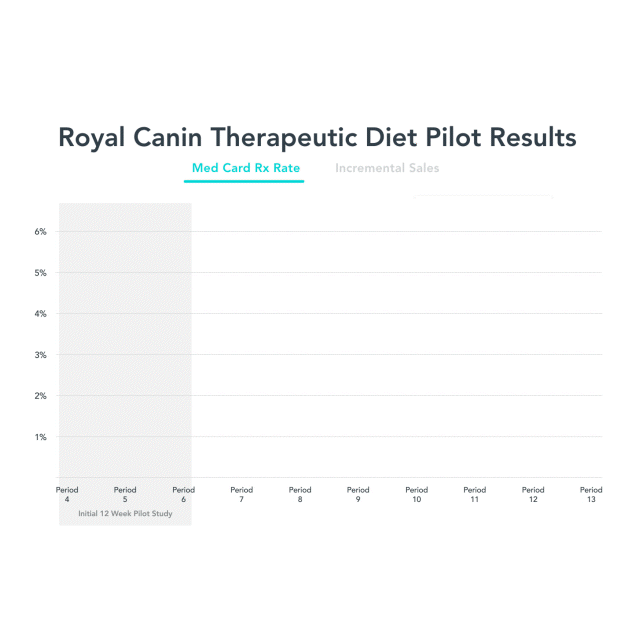
We designed and built two front-end experiences for the Kinship Data Studio. The first was an updated Diet Funnel Story, a structured narrative experience walking audiences through a pet nutrition pilot study, personalized with real case study results and designed to cover more ground with fewer screens. The second was Pet Map, a fully interactive data exploration tool connected to Kinship's data lake. Users could select criteria across categories including breed and ailment, then watch results populate dynamically on a live map. A collapsible dashboard alongside the map gave users a clean summary view that could expand to reveal deeper data on demand.


Related work
Kinship Digital
Kinship Digital
Roads to Regeneration
Roads to Regeneration
